Nota
Haz clic en aquí para descargar el código de ejemplo completo o para ejecutar este ejemplo en tu navegador a través de Binder
Descomposición de conjuntos de datos de caras
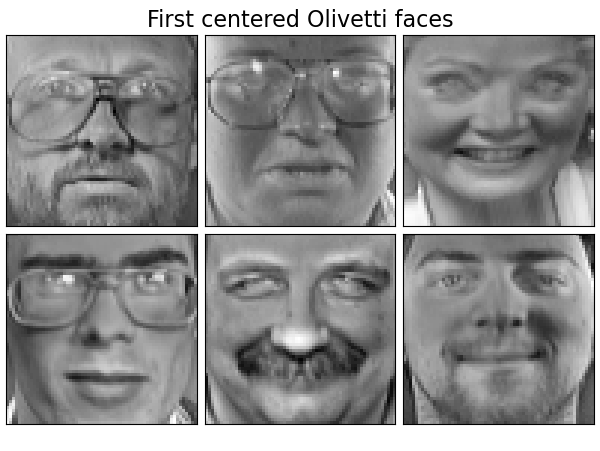
Este ejemplo aplica a El conjunto de datos de caras Olivetti diferentes métodos de descomposición de matrices no supervisadas (reducción de dimensión) del módulo sklearn.decomposition (ver el capítulo de documentación Descomposición de señales en componentes (problemas de factorización de matrices)) .
Out:
Dataset consists of 400 faces
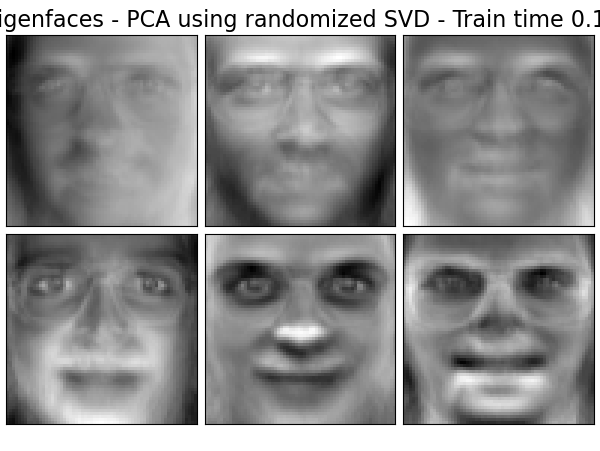
Extracting the top 6 Eigenfaces - PCA using randomized SVD...
done in 0.094s
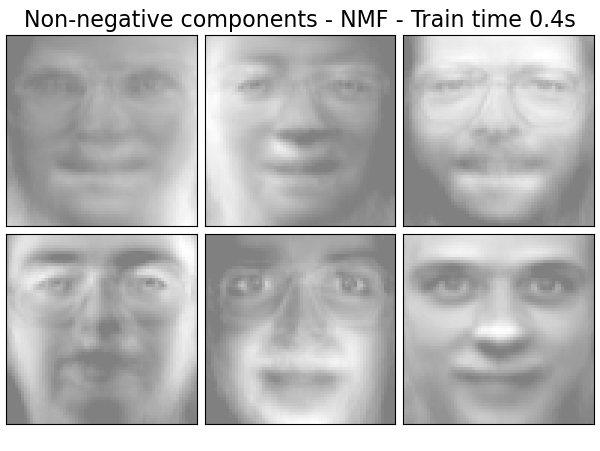
Extracting the top 6 Non-negative components - NMF...
done in 0.355s
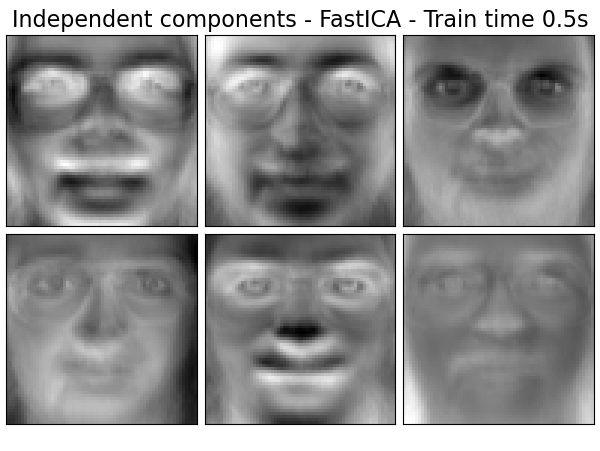
Extracting the top 6 Independent components - FastICA...
done in 0.510s
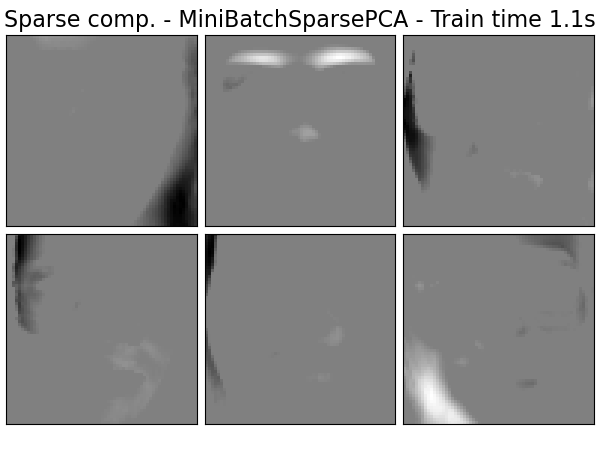
Extracting the top 6 Sparse comp. - MiniBatchSparsePCA...
done in 1.103s
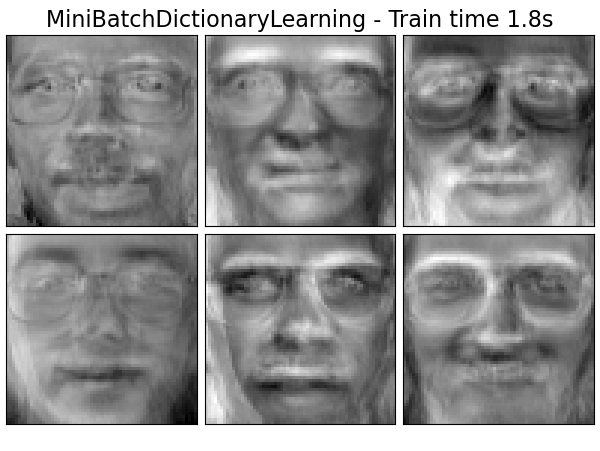
Extracting the top 6 MiniBatchDictionaryLearning...
done in 1.810s
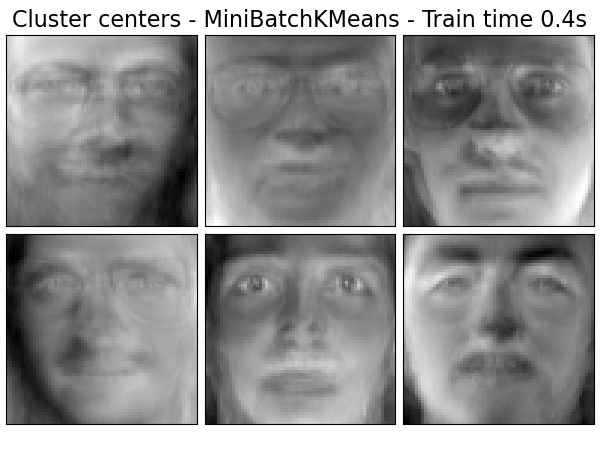
Extracting the top 6 Cluster centers - MiniBatchKMeans...
done in 0.443s
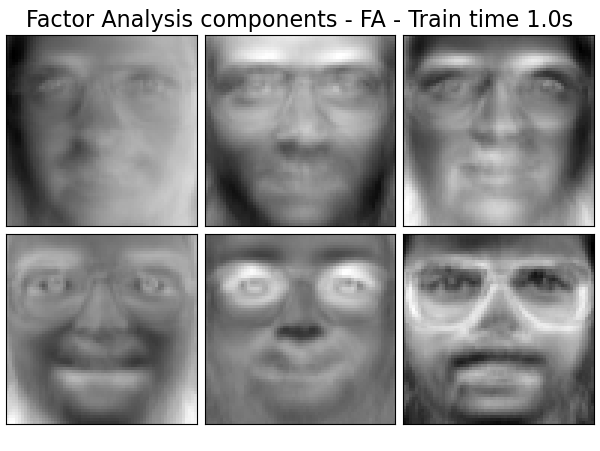
Extracting the top 6 Factor Analysis components - FA...
done in 1.013s
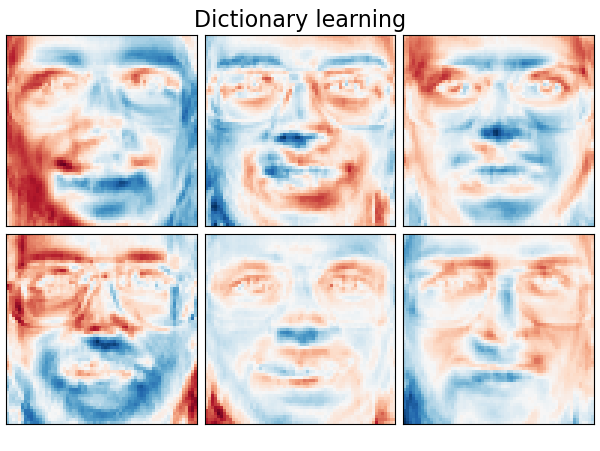
Extracting the top 6 Dictionary learning...
done in 1.566s
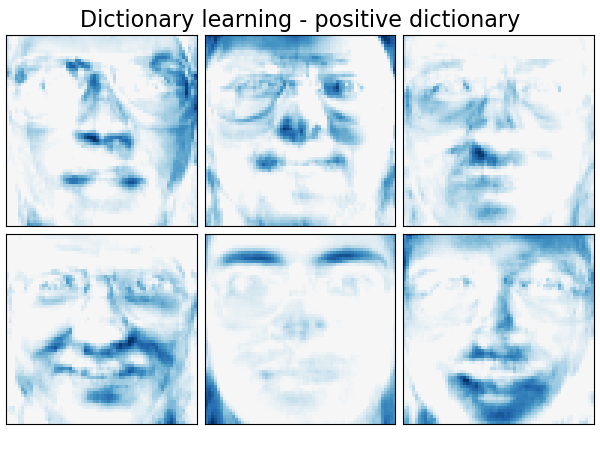
Extracting the top 6 Dictionary learning - positive dictionary...
done in 3.431s
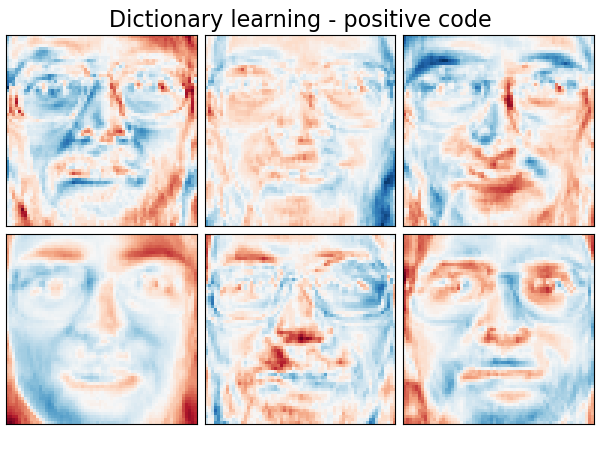
Extracting the top 6 Dictionary learning - positive code...
done in 1.382s
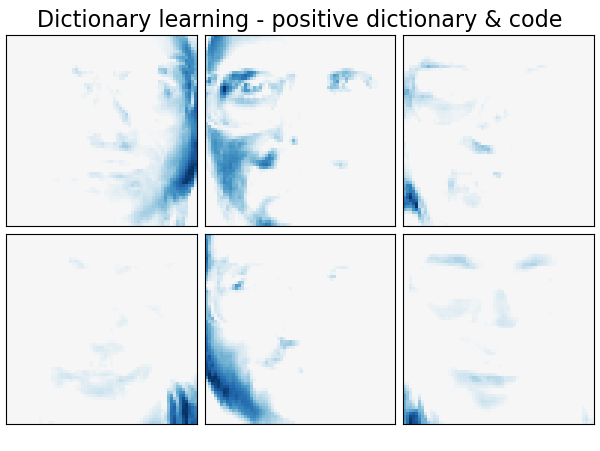
Extracting the top 6 Dictionary learning - positive dictionary & code...
done in 1.605s
print(__doc__)
# Authors: Vlad Niculae, Alexandre Gramfort
# License: BSD 3 clause
import logging
from time import time
from numpy.random import RandomState
import matplotlib.pyplot as plt
from sklearn.datasets import fetch_olivetti_faces
from sklearn.cluster import MiniBatchKMeans
from sklearn import decomposition
# Display progress logs on stdout
logging.basicConfig(level=logging.INFO,
format='%(asctime)s %(levelname)s %(message)s')
n_row, n_col = 2, 3
n_components = n_row * n_col
image_shape = (64, 64)
rng = RandomState(0)
# #############################################################################
# Load faces data
faces, _ = fetch_olivetti_faces(return_X_y=True, shuffle=True,
random_state=rng)
n_samples, n_features = faces.shape
# global centering
faces_centered = faces - faces.mean(axis=0)
# local centering
faces_centered -= faces_centered.mean(axis=1).reshape(n_samples, -1)
print("Dataset consists of %d faces" % n_samples)
def plot_gallery(title, images, n_col=n_col, n_row=n_row, cmap=plt.cm.gray):
plt.figure(figsize=(2. * n_col, 2.26 * n_row))
plt.suptitle(title, size=16)
for i, comp in enumerate(images):
plt.subplot(n_row, n_col, i + 1)
vmax = max(comp.max(), -comp.min())
plt.imshow(comp.reshape(image_shape), cmap=cmap,
interpolation='nearest',
vmin=-vmax, vmax=vmax)
plt.xticks(())
plt.yticks(())
plt.subplots_adjust(0.01, 0.05, 0.99, 0.93, 0.04, 0.)
# #############################################################################
# List of the different estimators, whether to center and transpose the
# problem, and whether the transformer uses the clustering API.
estimators = [
('Eigenfaces - PCA using randomized SVD',
decomposition.PCA(n_components=n_components, svd_solver='randomized',
whiten=True),
True),
('Non-negative components - NMF',
decomposition.NMF(n_components=n_components, init='nndsvda', tol=5e-3),
False),
('Independent components - FastICA',
decomposition.FastICA(n_components=n_components, whiten=True),
True),
('Sparse comp. - MiniBatchSparsePCA',
decomposition.MiniBatchSparsePCA(n_components=n_components, alpha=0.8,
n_iter=100, batch_size=3,
random_state=rng),
True),
('MiniBatchDictionaryLearning',
decomposition.MiniBatchDictionaryLearning(n_components=15, alpha=0.1,
n_iter=50, batch_size=3,
random_state=rng),
True),
('Cluster centers - MiniBatchKMeans',
MiniBatchKMeans(n_clusters=n_components, tol=1e-3, batch_size=20,
max_iter=50, random_state=rng),
True),
('Factor Analysis components - FA',
decomposition.FactorAnalysis(n_components=n_components, max_iter=20),
True),
]
# #############################################################################
# Plot a sample of the input data
plot_gallery("First centered Olivetti faces", faces_centered[:n_components])
# #############################################################################
# Do the estimation and plot it
for name, estimator, center in estimators:
print("Extracting the top %d %s..." % (n_components, name))
t0 = time()
data = faces
if center:
data = faces_centered
estimator.fit(data)
train_time = (time() - t0)
print("done in %0.3fs" % train_time)
if hasattr(estimator, 'cluster_centers_'):
components_ = estimator.cluster_centers_
else:
components_ = estimator.components_
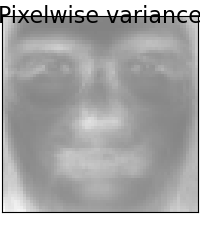
# Plot an image representing the pixelwise variance provided by the
# estimator e.g its noise_variance_ attribute. The Eigenfaces estimator,
# via the PCA decomposition, also provides a scalar noise_variance_
# (the mean of pixelwise variance) that cannot be displayed as an image
# so we skip it.
if (hasattr(estimator, 'noise_variance_') and
estimator.noise_variance_.ndim > 0): # Skip the Eigenfaces case
plot_gallery("Pixelwise variance",
estimator.noise_variance_.reshape(1, -1), n_col=1,
n_row=1)
plot_gallery('%s - Train time %.1fs' % (name, train_time),
components_[:n_components])
plt.show()
# #############################################################################
# Various positivity constraints applied to dictionary learning.
estimators = [
('Dictionary learning',
decomposition.MiniBatchDictionaryLearning(n_components=15, alpha=0.1,
n_iter=50, batch_size=3,
random_state=rng),
True),
('Dictionary learning - positive dictionary',
decomposition.MiniBatchDictionaryLearning(n_components=15, alpha=0.1,
n_iter=50, batch_size=3,
random_state=rng,
positive_dict=True),
True),
('Dictionary learning - positive code',
decomposition.MiniBatchDictionaryLearning(n_components=15, alpha=0.1,
n_iter=50, batch_size=3,
fit_algorithm='cd',
random_state=rng,
positive_code=True),
True),
('Dictionary learning - positive dictionary & code',
decomposition.MiniBatchDictionaryLearning(n_components=15, alpha=0.1,
n_iter=50, batch_size=3,
fit_algorithm='cd',
random_state=rng,
positive_dict=True,
positive_code=True),
True),
]
# #############################################################################
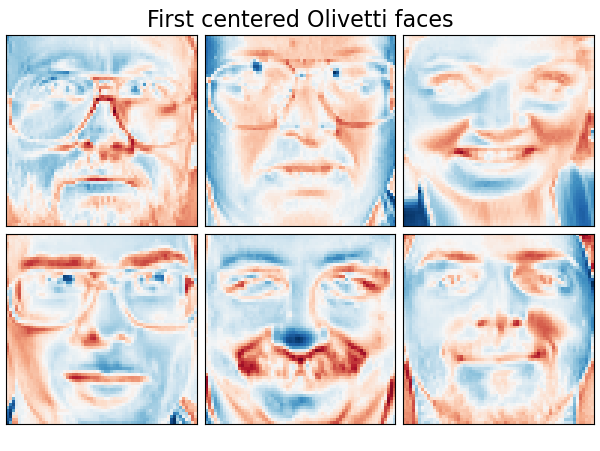
# Plot a sample of the input data
plot_gallery("First centered Olivetti faces", faces_centered[:n_components],
cmap=plt.cm.RdBu)
# #############################################################################
# Do the estimation and plot it
for name, estimator, center in estimators:
print("Extracting the top %d %s..." % (n_components, name))
t0 = time()
data = faces
if center:
data = faces_centered
estimator.fit(data)
train_time = (time() - t0)
print("done in %0.3fs" % train_time)
components_ = estimator.components_
plot_gallery(name, components_[:n_components], cmap=plt.cm.RdBu)
plt.show()
Tiempo total de ejecución del script: (0 minutos 16.407 segundos)