Nota
Haz clic aquí para descargar el código completo del ejemplo o para ejecutar este ejemplo en tu navegador a través de Binder
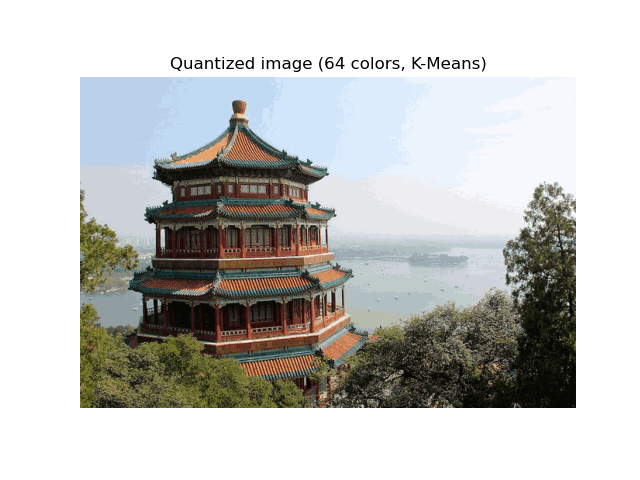
Cuantificación del color utilizando K-Medias
Realiza una cuantificación vectorial (VQ) por píxeles de una imagen del palacio de verano (China), reduciendo el número de colores necesarios para mostrar la imagen de 96,615 colores únicos a 64, al tiempo que se conserva la calidad de apariencia general.
En este ejemplo, los píxeles se representan en un espacio 3D y se utiliza K-medias para encontrar 64 conglomerados de color. En la literatura de procesamiento de imágenes, el libro de códigos obtenido a partir de K-medias (los centros de los conglomerados) se denominan paleta de colores. Utilizando un solo byte, se pueden abordar hasta 256 colores, mientras que una codificación RGB requiere 3 bytes por píxel. El formato de archivo GIF, por ejemplo, utiliza una paleta de este tipo.
A modo de comparación, también se muestra una imagen cuantificada utilizando un libro de códigos aleatorio (colores elegidos aleatoriamente).


Out:
Fitting model on a small sub-sample of the data
done in 1.456s.
Predicting color indices on the full image (k-means)
done in 0.062s.
Predicting color indices on the full image (random)
done in 0.324s.
# Authors: Robert Layton <robertlayton@gmail.com>
#          Olivier Grisel <olivier.grisel@ensta.org>
#          Mathieu Blondel <mathieu@mblondel.org>
#
# License: BSD 3 clause

print(__doc__)
import numpy as np
import matplotlib.pyplot as plt
from sklearn.cluster import KMeans
from sklearn.metrics import pairwise_distances_argmin
from sklearn.datasets import load_sample_image
from sklearn.utils import shuffle
from time import time

n_colors = 64

# Load the Summer Palace photo
china = load_sample_image("china.jpg")

# Convert to floats instead of the default 8 bits integer coding. Dividing by
# 255 is important so that plt.imshow behaves works well on float data (need to
# be in the range [0-1])
china = np.array(china, dtype=np.float64) / 255

# Load Image and transform to a 2D numpy array.
w, h, d = original_shape = tuple(china.shape)
assert d == 3
image_array = np.reshape(china, (w * h, d))

print("Fitting model on a small sub-sample of the data")
t0 = time()
image_array_sample = shuffle(image_array, random_state=0)[:1000]
kmeans = KMeans(n_clusters=n_colors, random_state=0).fit(image_array_sample)
print("done in %0.3fs." % (time() - t0))

# Get labels for all points
print("Predicting color indices on the full image (k-means)")
t0 = time()
labels = kmeans.predict(image_array)
print("done in %0.3fs." % (time() - t0))


codebook_random = shuffle(image_array, random_state=0)[:n_colors]
print("Predicting color indices on the full image (random)")
t0 = time()
labels_random = pairwise_distances_argmin(codebook_random,
                                          image_array,
                                          axis=0)
print("done in %0.3fs." % (time() - t0))


def recreate_image(codebook, labels, w, h):
    """Recreate the (compressed) image from the code book & labels"""
    d = codebook.shape[1]
    image = np.zeros((w, h, d))
    label_idx = 0
    for i in range(w):
        for j in range(h):
            image[i][j] = codebook[labels[label_idx]]
            label_idx += 1
    return image

# Display all results, alongside original image
plt.figure(1)
plt.clf()
plt.axis('off')
plt.title('Original image (96,615 colors)')
plt.imshow(china)

plt.figure(2)
plt.clf()
plt.axis('off')
plt.title('Quantized image (64 colors, K-Means)')
plt.imshow(recreate_image(kmeans.cluster_centers_, labels, w, h))

plt.figure(3)
plt.clf()
plt.axis('off')
plt.title('Quantized image (64 colors, Random)')
plt.imshow(recreate_image(codebook_random, labels_random, w, h))
plt.show()
Tiempo total de ejecución del script: (0 minutos 2.704 segundos)