Nota
Haz clic en aquí para descargar el código de ejemplo completo o para ejecutar este ejemplo en tu navegador a través de Binder
Mínimos cuadrados no negativos
En este ejemplo, ajustamos un modelo lineal con restricciones positivas en los coeficientes de regresión y comparamos los coeficientes estimados con una regresión lineal clásica.
print(__doc__)
import numpy as np
import matplotlib.pyplot as plt
from sklearn.metrics import r2_score
Generar algunos datos aleatorios
np.random.seed(42)

n_samples, n_features = 200, 50
X = np.random.randn(n_samples, n_features)
true_coef = 3 * np.random.randn(n_features)
# Threshold coefficients to render them non-negative
true_coef[true_coef < 0] = 0
y = np.dot(X, true_coef)

# Add some noise
y += 5 * np.random.normal(size=(n_samples, ))
Dividir los datos en conjunto de entrenamiento y conjunto de prueba
from sklearn.model_selection import train_test_split

X_train, X_test, y_train, y_test = train_test_split(X, y, test_size=0.5)
Ajustar los mínimos cuadrados no negativos.
from sklearn.linear_model import LinearRegression

reg_nnls = LinearRegression(positive=True)
y_pred_nnls = reg_nnls.fit(X_train, y_train).predict(X_test)
r2_score_nnls = r2_score(y_test, y_pred_nnls)
print("NNLS R2 score", r2_score_nnls)
Out:
NNLS R2 score 0.8225220806196526
Ajustar un OLS.
reg_ols = LinearRegression()
y_pred_ols = reg_ols.fit(X_train, y_train).predict(X_test)
r2_score_ols = r2_score(y_test, y_pred_ols)
print("OLS R2 score", r2_score_ols)
Out:
OLS R2 score 0.7436926291700352
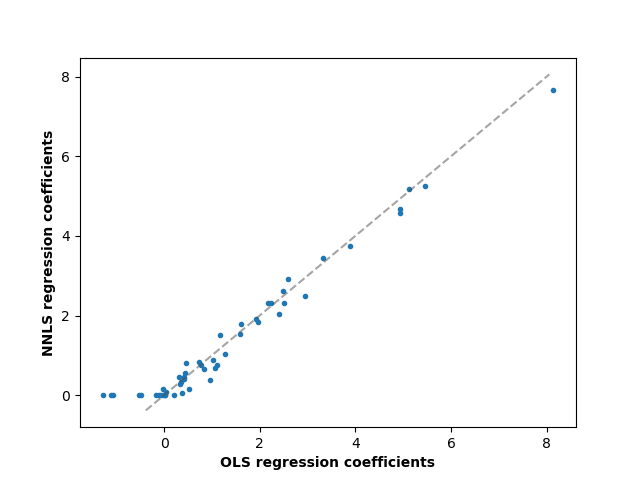
Comparando los coeficientes de regresión entre OLS y NNLS, podemos observar que están muy correlacionados (la línea discontinua es la relación de identidad), pero la restricción no negativa reduce algunos a 0. Los mínimos cuadrados no negativos producen intrínsecamente resultados dispersos.
fig, ax = plt.subplots()
ax.plot(reg_ols.coef_, reg_nnls.coef_, linewidth=0, marker=".")

low_x, high_x = ax.get_xlim()
low_y, high_y = ax.get_ylim()
low = max(low_x, low_y)
high = min(high_x, high_y)
ax.plot([low, high], [low, high], ls="--", c=".3", alpha=.5)
ax.set_xlabel("OLS regression coefficients", fontweight="bold")
ax.set_ylabel("NNLS regression coefficients", fontweight="bold")

Out:
Text(55.847222222222214, 0.5, 'NNLS regression coefficients')
Tiempo total de ejecución del script: ( 0 minutos 0.153 segundos)
